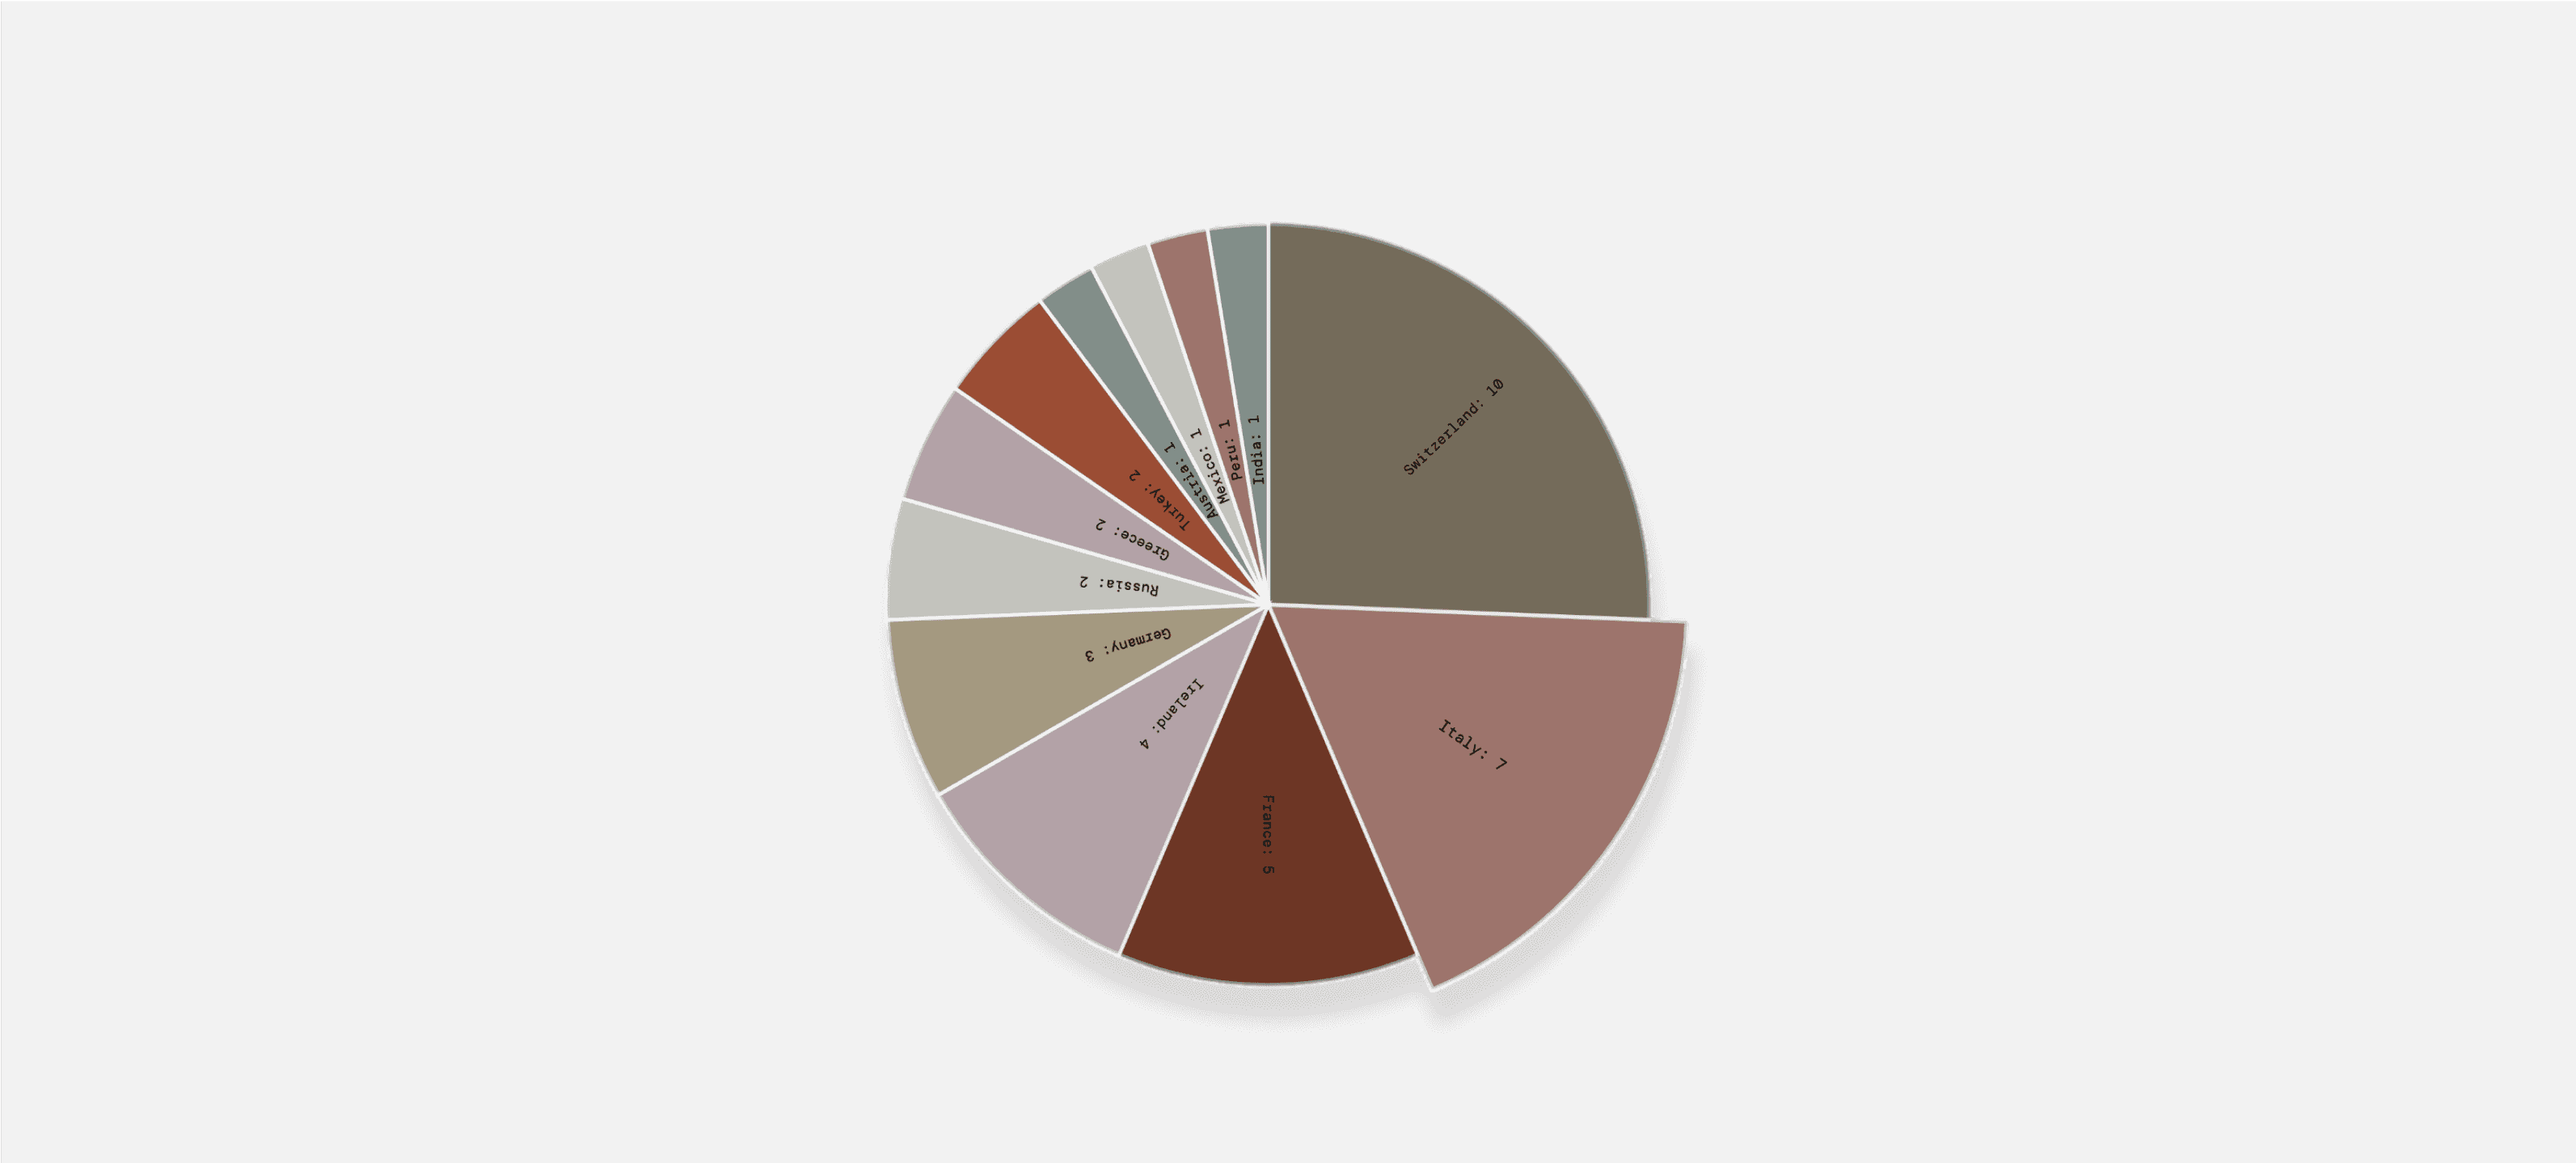
Data Visualization project presents a pie chart that illustrates the frequency of mentions for various countries within the novel of "Frankenstein". Leveraging D3.js for dynamic visualization and RiTa for robust text processing, this chart meticulously identifies and counts references to different geographical locations throughout the novel. The chart is designed with custom colors for enhanced clarity and includes interactive elements like hover effects to enrich the viewing experience and provide additional context on demand.

Data Visualization project presents a pie chart that illustrates the frequency of mentions for various countries within the novel of "Frankenstein". Leveraging D3.js for dynamic visualization and RiTa for robust text processing, this chart meticulously identifies and counts references to different geographical locations throughout the novel. The chart is designed with custom colors for enhanced clarity and includes interactive elements like hover effects to enrich the viewing experience and provide additional context on demand.

Data Visualization project presents a pie chart that illustrates the frequency of mentions for various countries within the novel of "Frankenstein". Leveraging D3.js for dynamic visualization and RiTa for robust text processing, this chart meticulously identifies and counts references to different geographical locations throughout the novel. The chart is designed with custom colors for enhanced clarity and includes interactive elements like hover effects to enrich the viewing experience and provide additional context on demand.

Time

Feb 2024

Client

Personal Project

Role

Front-end

Contribution

D3.js

Visual Design


Tools

Github

VS Code

Time

Jan 2024 — Feb 2024

Client

Personal Project

Role

Front-end & Web designer

Contribution

API
Web Design

Visual Design

Tools

Github

VS Code

Time

Feb 2024

Client

Personal Project

Role

Front-end

Contribution

D3.js

Visual Design


Tools

Github

VS Code

Time

Jan 2024 — Feb 2024

Client

Personal Project

Role

Front-end & Web designer

Contribution

API
Web Design

Visual Design

Tools

Github

VS Code

Fetching text from the novel called "Frankenstein"

Unveiling the Hidden Geography

Welcome to the interactive data visualization project, where I delve into the geographical dimensions of Mary Shelley's Frankenstein. This exploration highlights the novel's most frequently mentioned countries: Switzerland, Italy, and France. By examining these geographical references, I explored how they enrich the narrative and influence its central themes.
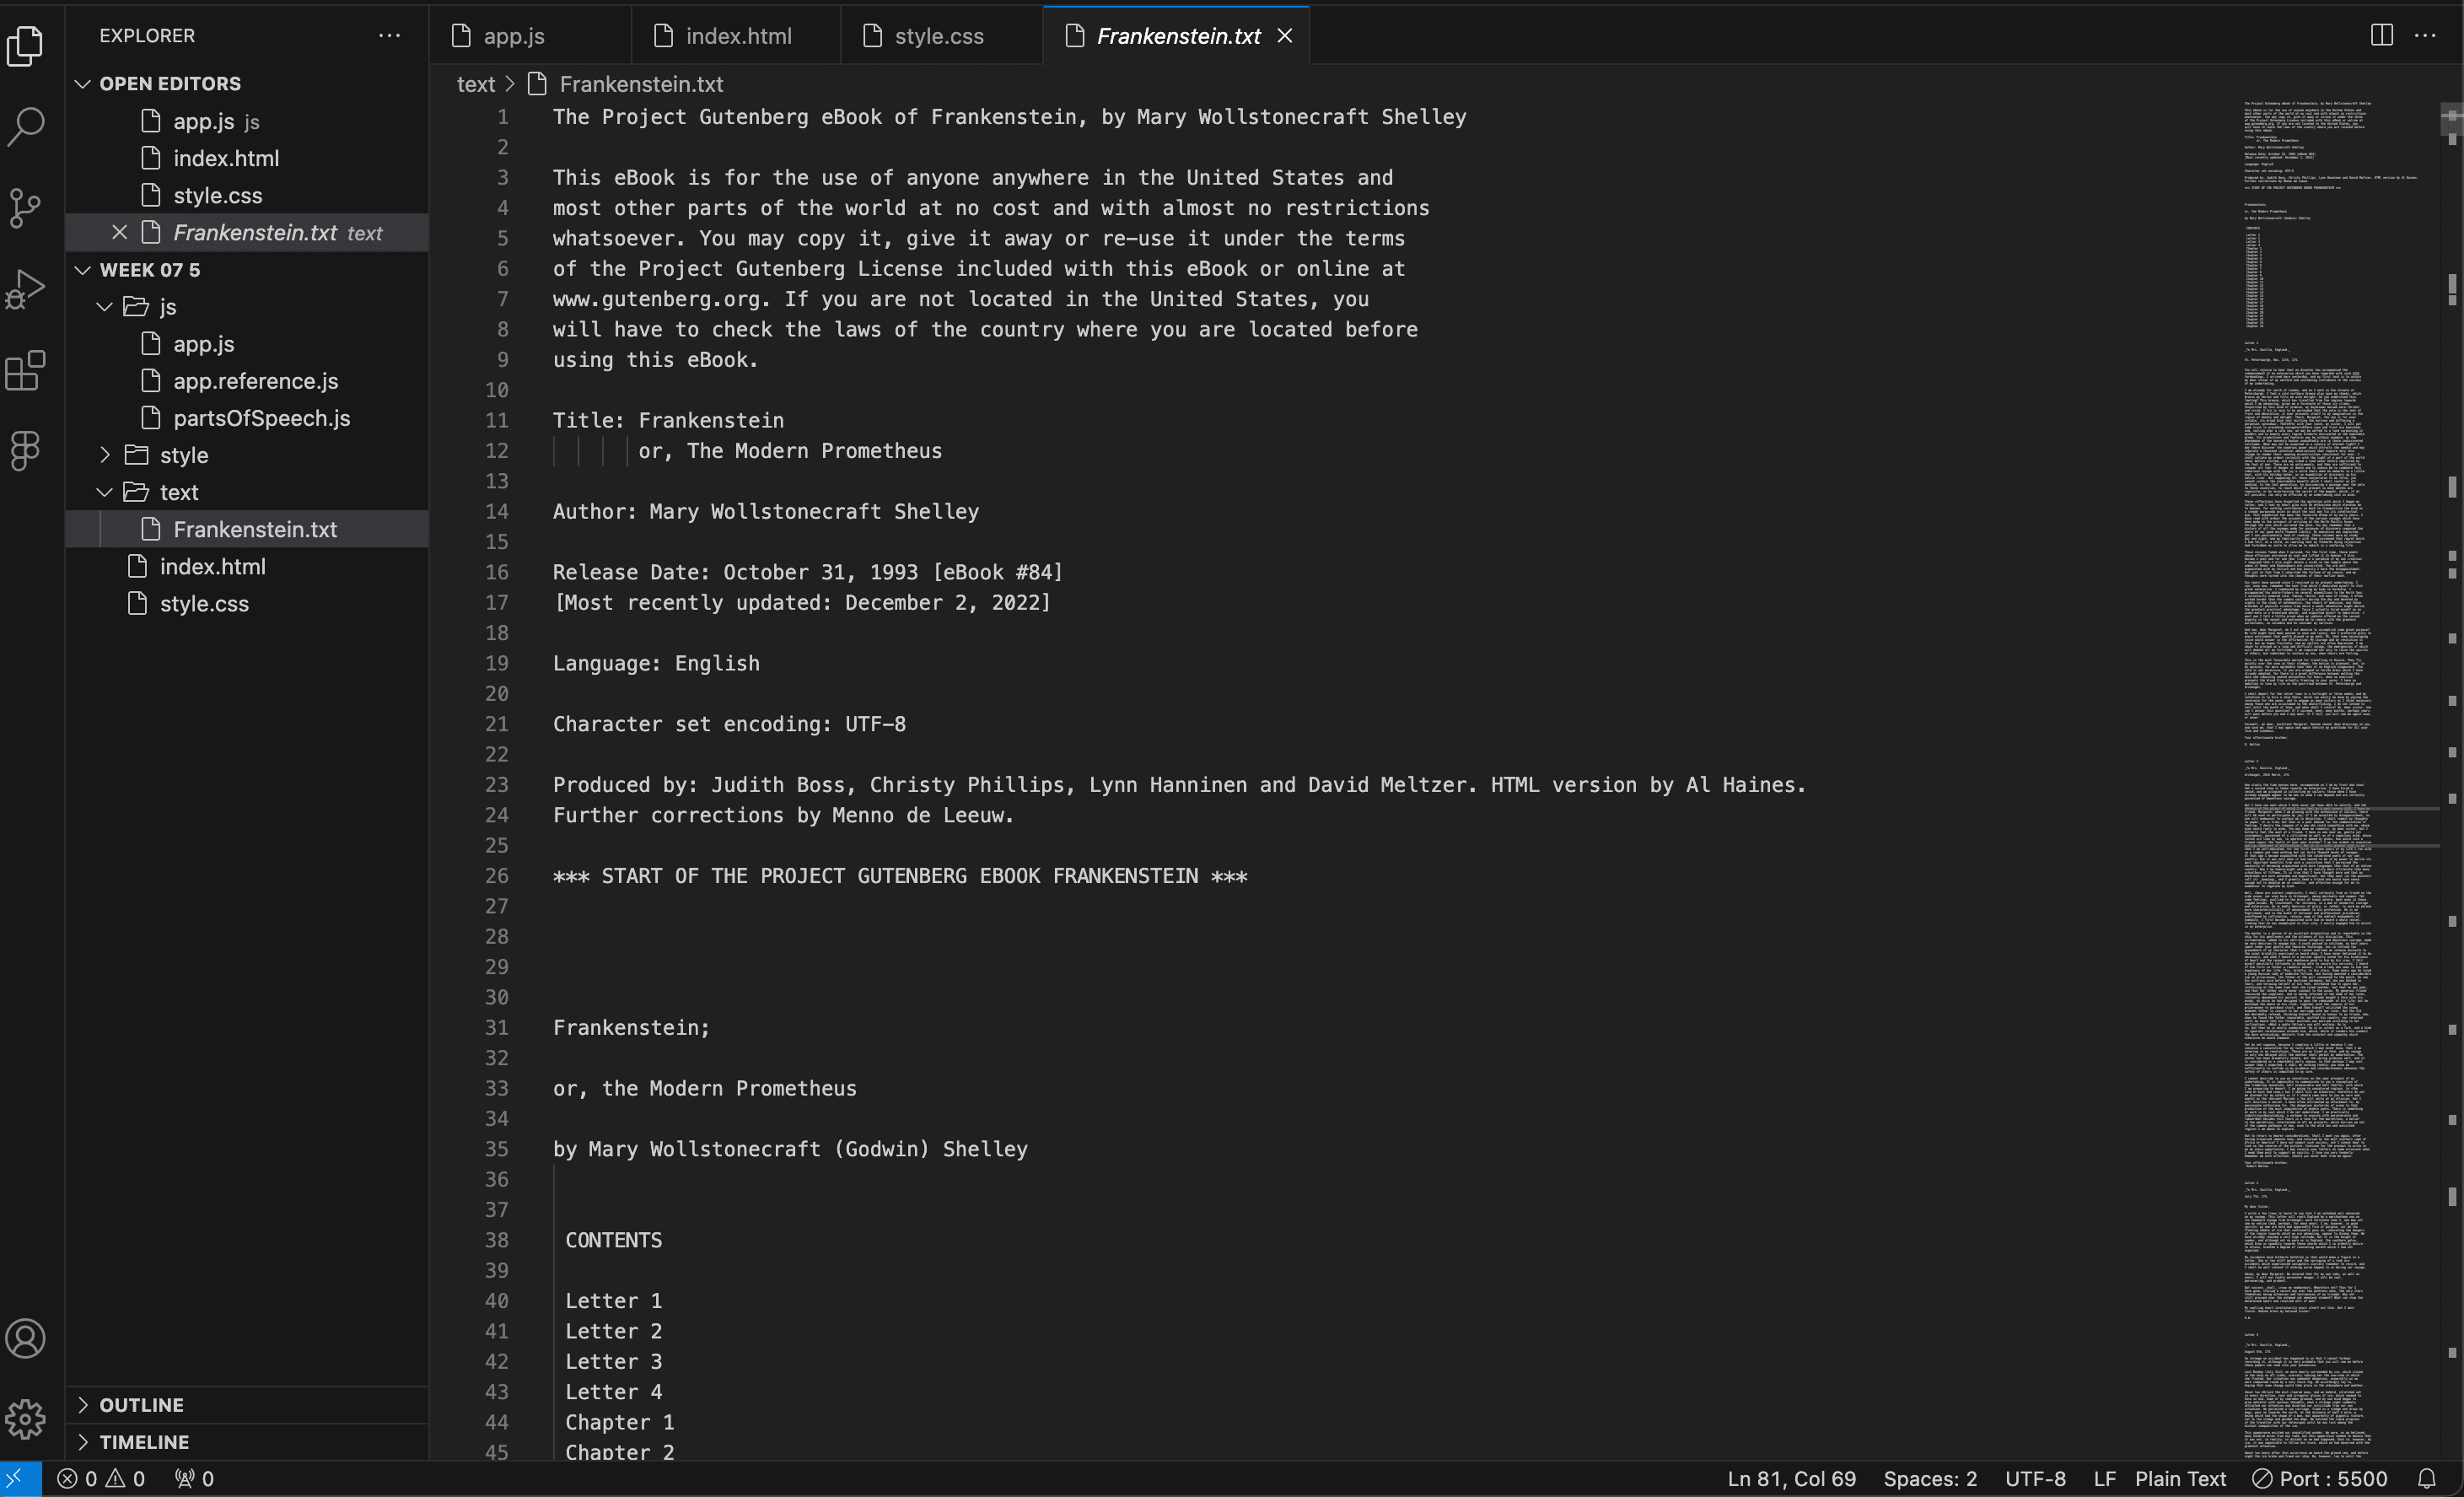
Original ebook text

Coding Process

Using the natural language processing capabilities of RiTa, we extracted every mention of geographical locations from the text of Frankenstein. These mentions predominantly highlight the landscapes of Switzerland, the cultural backdrop of Italy, and the historical context of France. Dynamic visualization, crafted with D3.js, offers an interactive pie chart that quantifies and elaborates on these references.
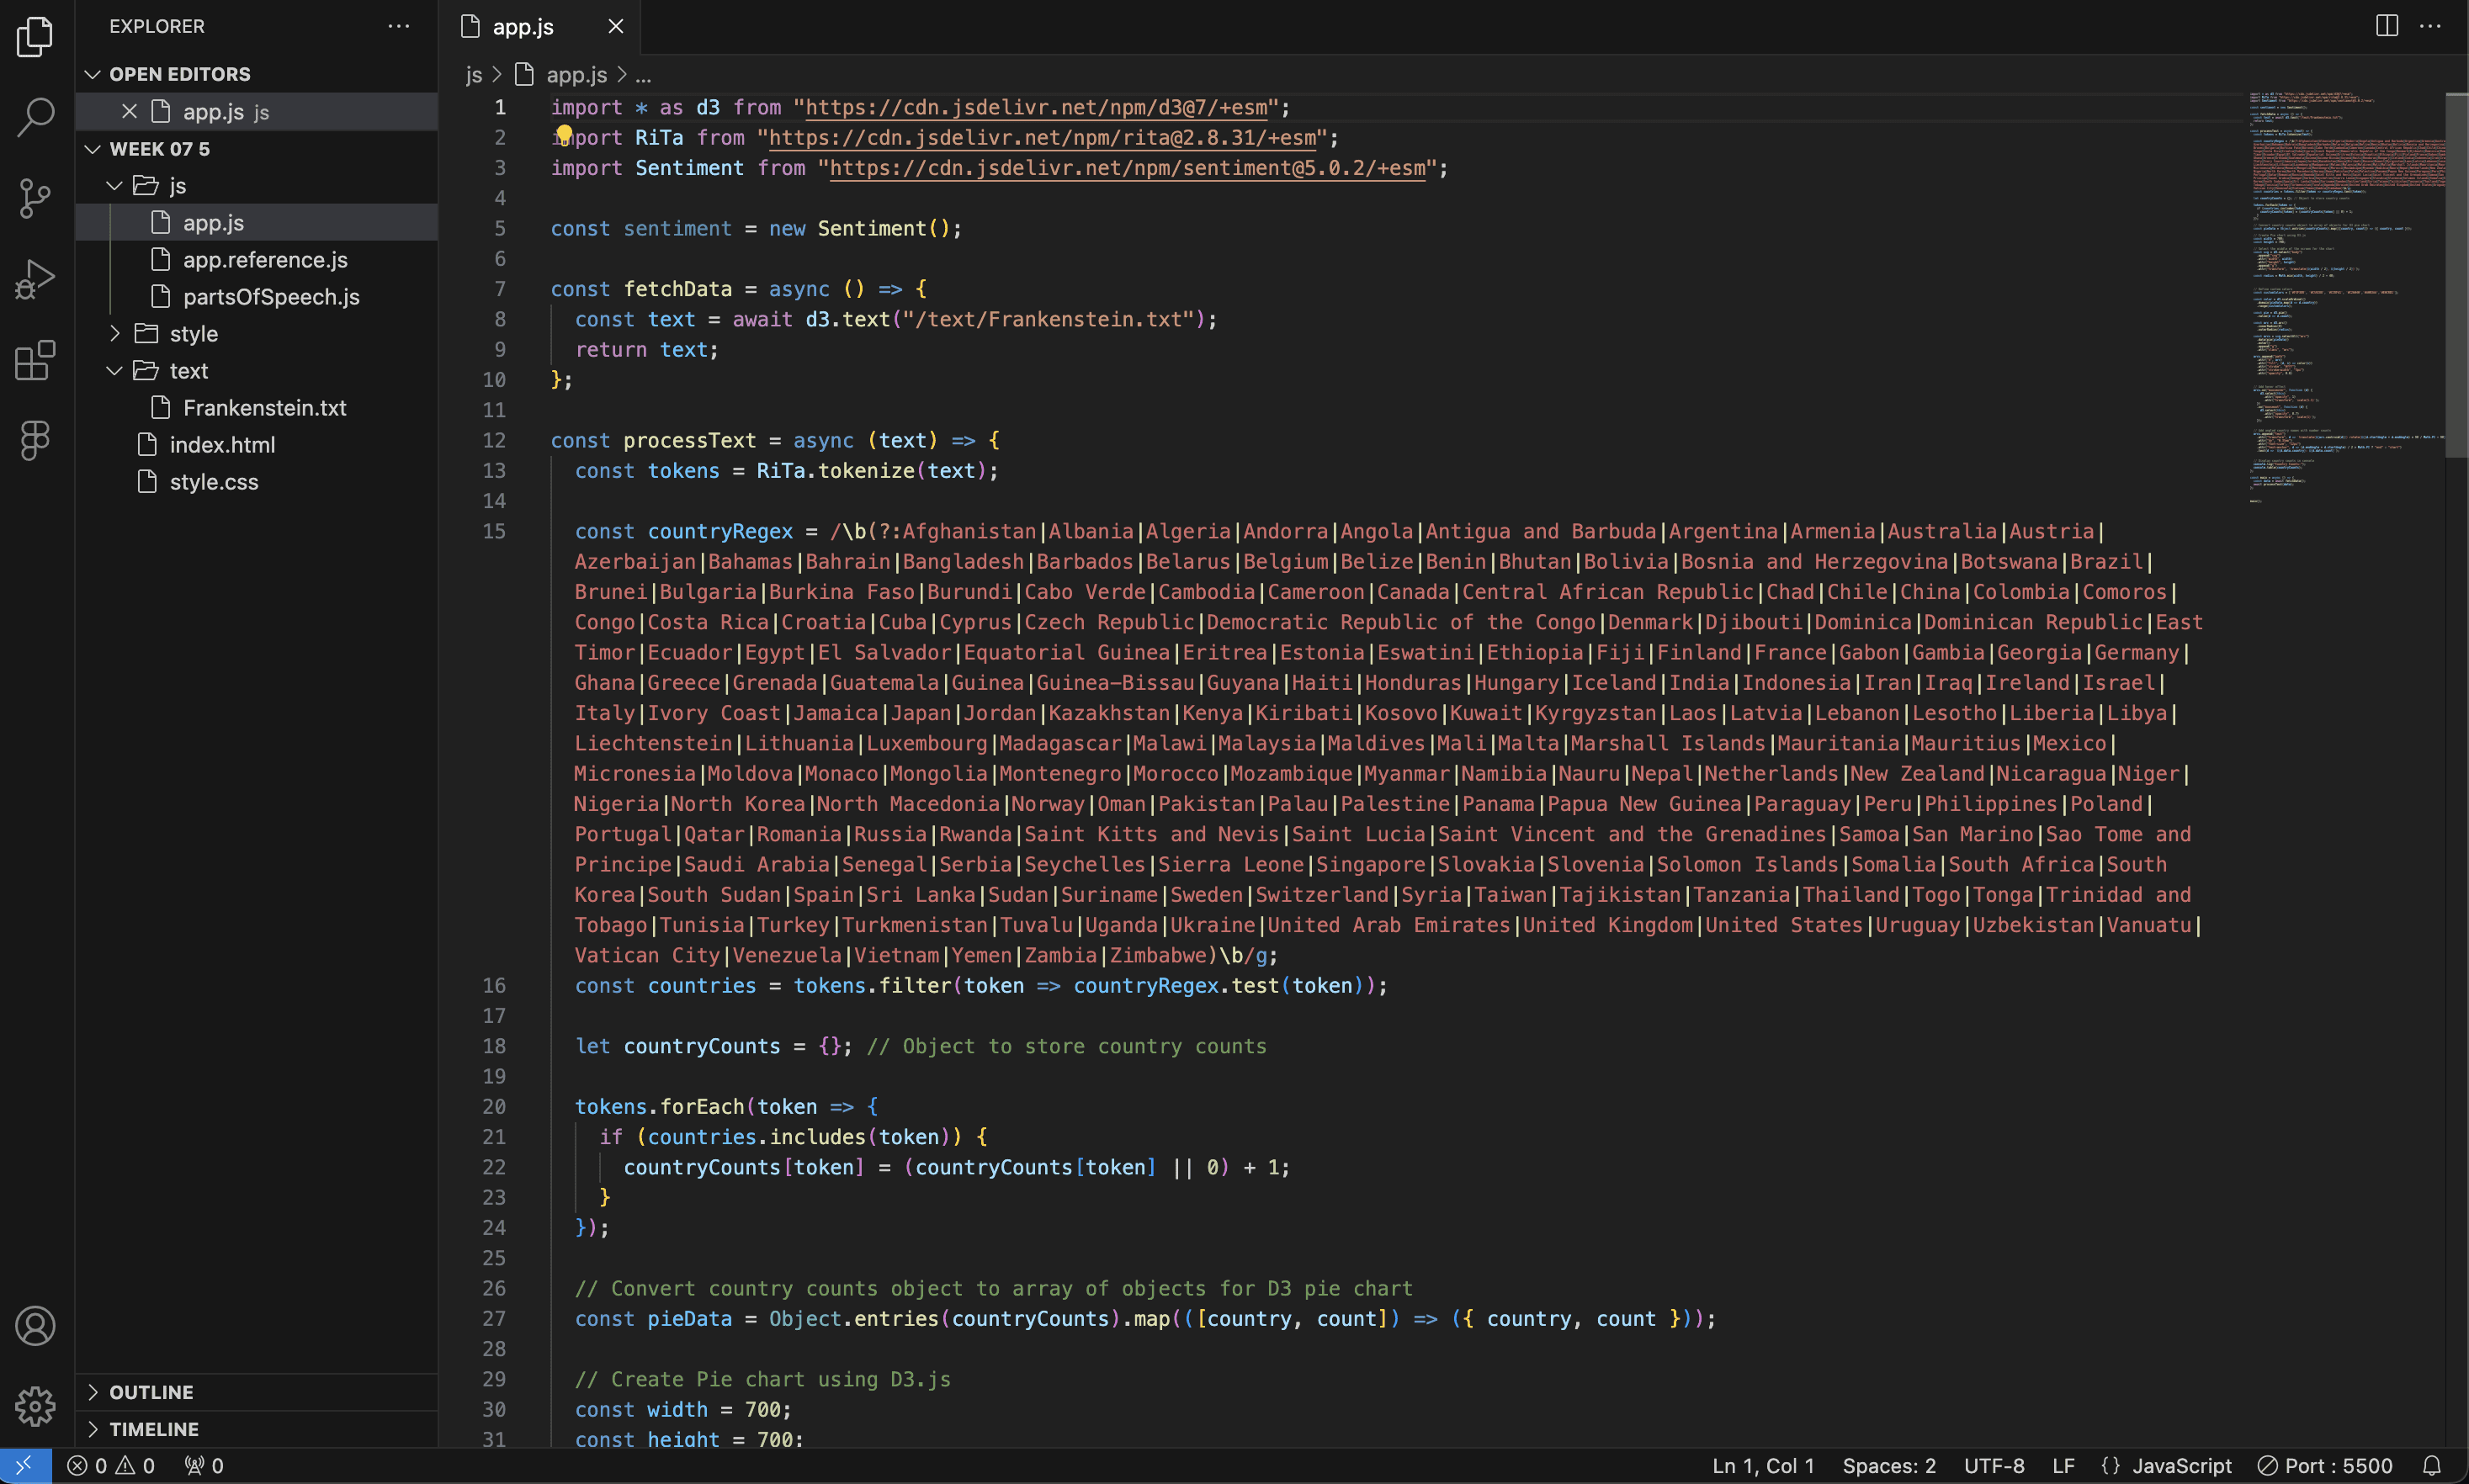


Using D3.js to fetch the country names through the whole novel

Using D3.js to fetch the country names through the whole novel

Chart Design Process

Interactive Visualization Features

Our pie chart is designed to be engaging and educational:


01- Custom Color Coding
Each slice is color of each different country to visually segregate the data.


02- Hover Effects
By hovering over each segment, users can see additional information about the number of mentions and their significance within the novel.

Insights from the Data

This visualization offers insights into the settings that shape the story:


01- Switzerland

As the home country of Victor Frankenstein and the primary setting of the novel, its frequent mentions suggest a backdrop of serene beauty juxtaposed with profound turmoil.


02- Italy and France

The mentions of these countries add a layer of cultural and historical depth, reflecting the characters' travels and the era's fascination with European heritage and landscapes.
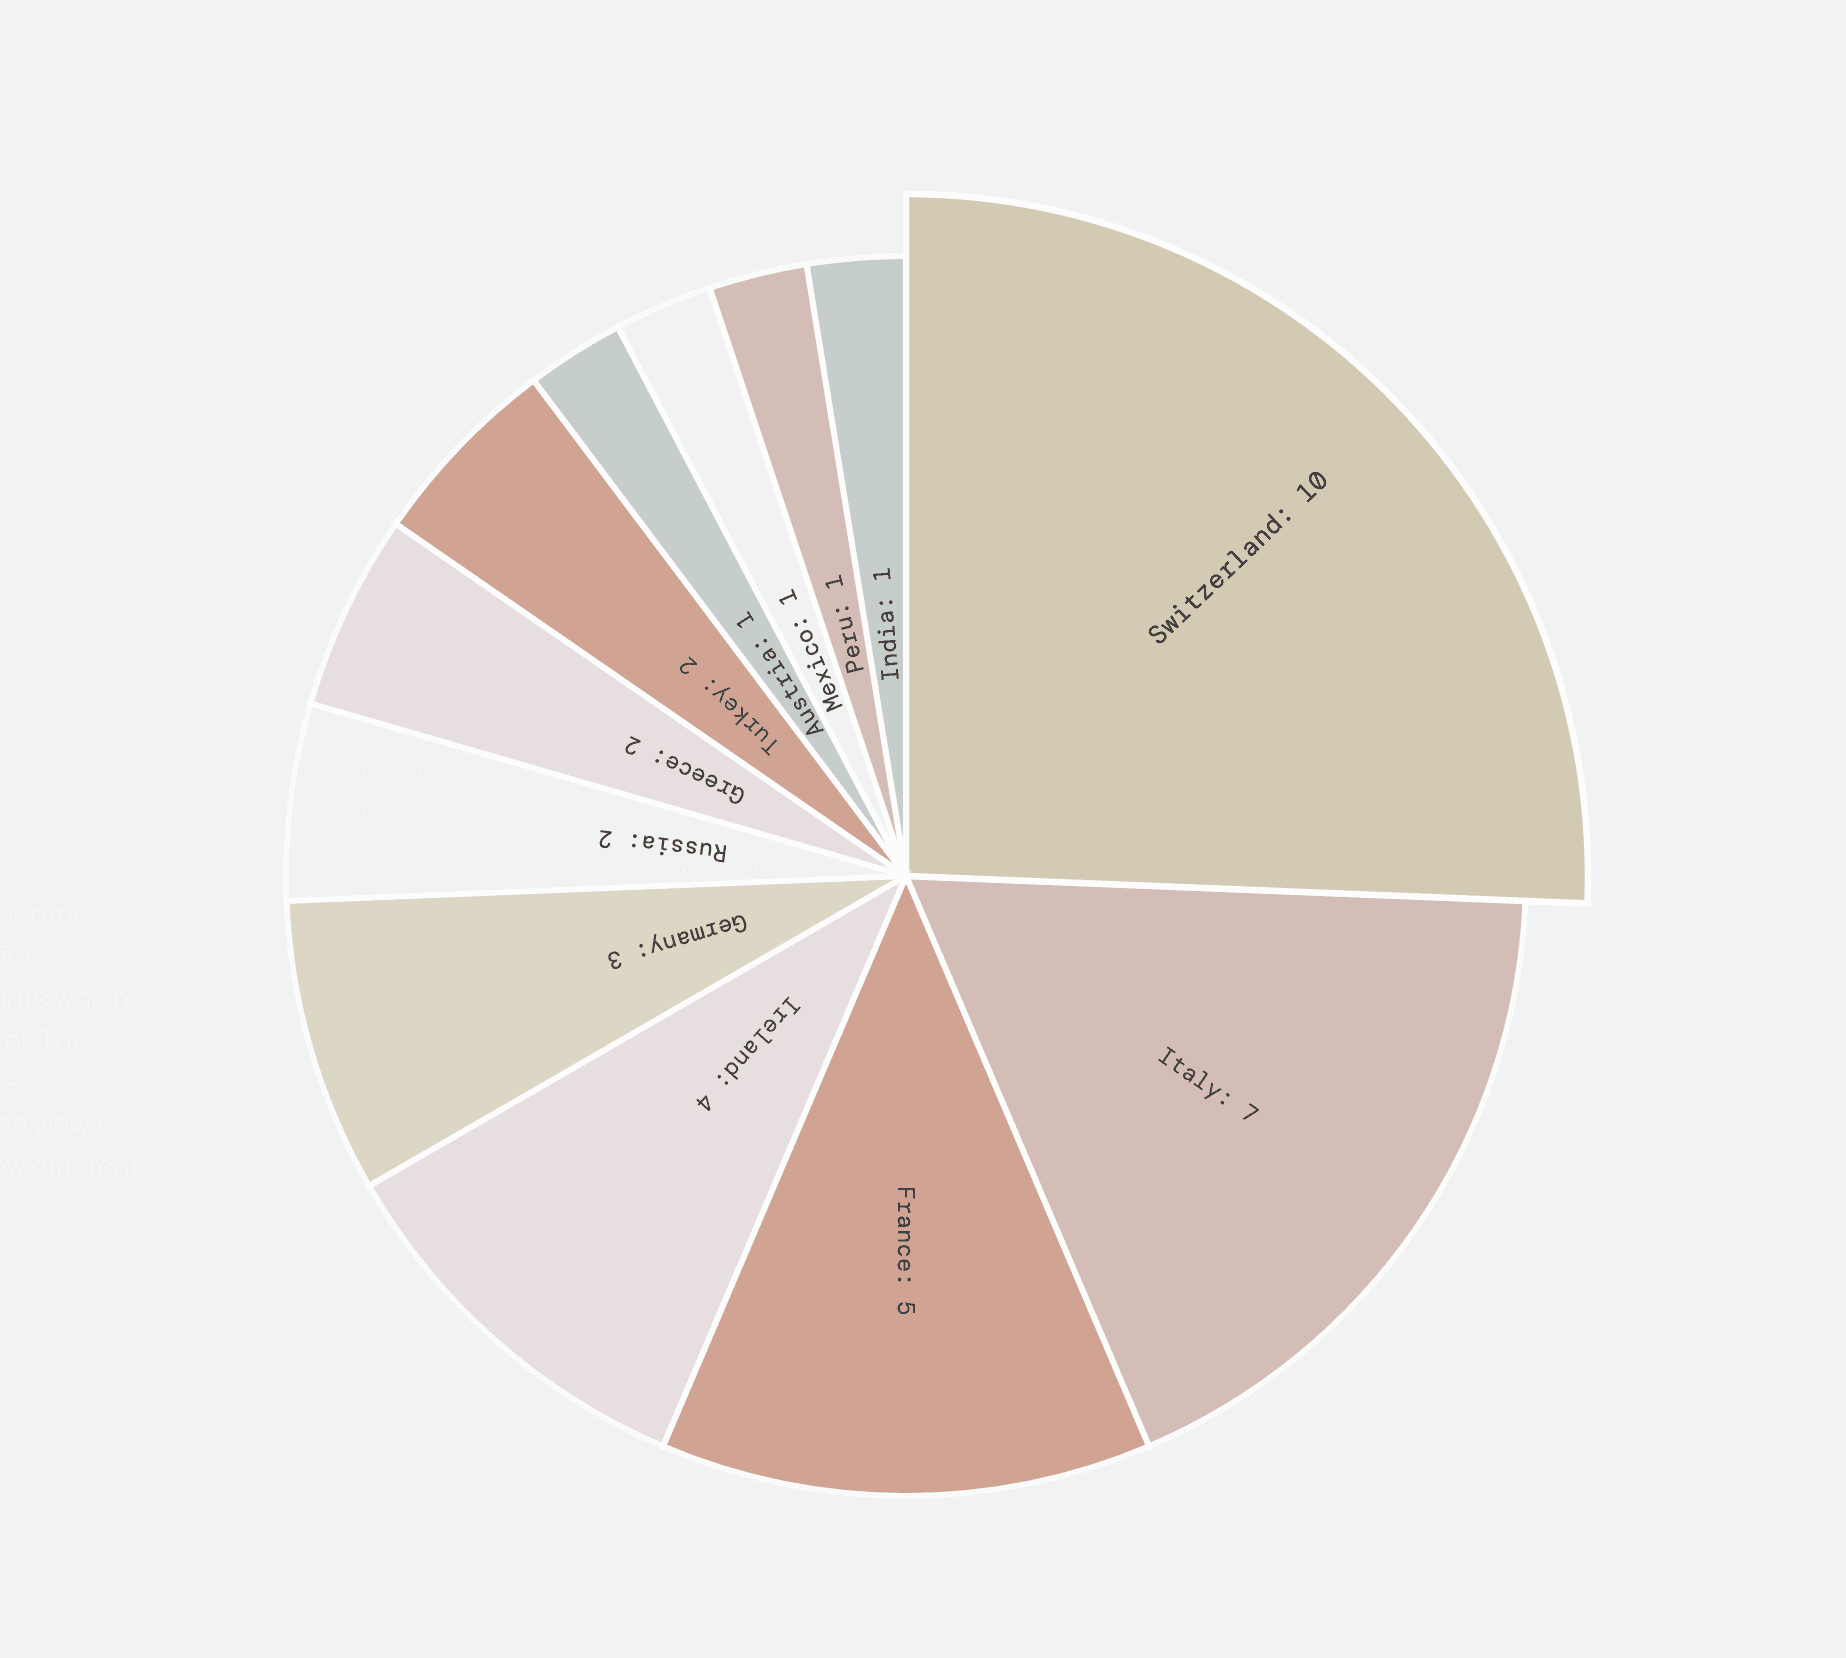

Visualization of the countries mentioned throughout the novel after the data has been successfully fetched

Visualization of the countries mentioned throughout the novel after the data has been successfully fetched

Visualization of the countries mentioned throughout the novel after the data has been successfully fetched

Takeaways

Explore & Learn

Discover how geographical references contribute to the narrative depth of Frankenstein and offer a richer understanding of Mary Shelley’s storytelling. This visualization not only maps the physical journey of the characters but also the thematic explorations of the author.

Literature & Coding

Creating this geographical country chart for Frankenstein highlights how location shapes the novel’s narrative. By focusing on the most mentioned countries—Switzerland, Italy, and France, I transformed abstract text into a clear visual representation of the setting. This project shows how data visualization can add new insights to literary analysis, making complex stories more accessible and engaging through the interactive power of tools like D3.js.

RELATED PROJECTS

RELATED PROJECTS